The Canadian housing bubble is now on the radar of Goldman Sachs, the same Wall Street investment bank that defrauded investors by overrating mortgage-backed securities, and selling them as fine grade investments.
In a research note this week, the bank estimated that Canada’s housing market has a 30 percent chance of crashing in the next two years. Canada, according to Goldman, has an elevated risk of a housing bust compared to its G10 counterparts, because of the level of consumer debt in Canadian households, that’s well above a healthy average.
Videos by VICE
This might sound hyperbolic, but as the next five charts will show you, there’s in fact a credible threat of a housing bust in Canada’s real estate market.
Chart 1: Home ownership rates in Canada have shot up since the 2008 financial crisis
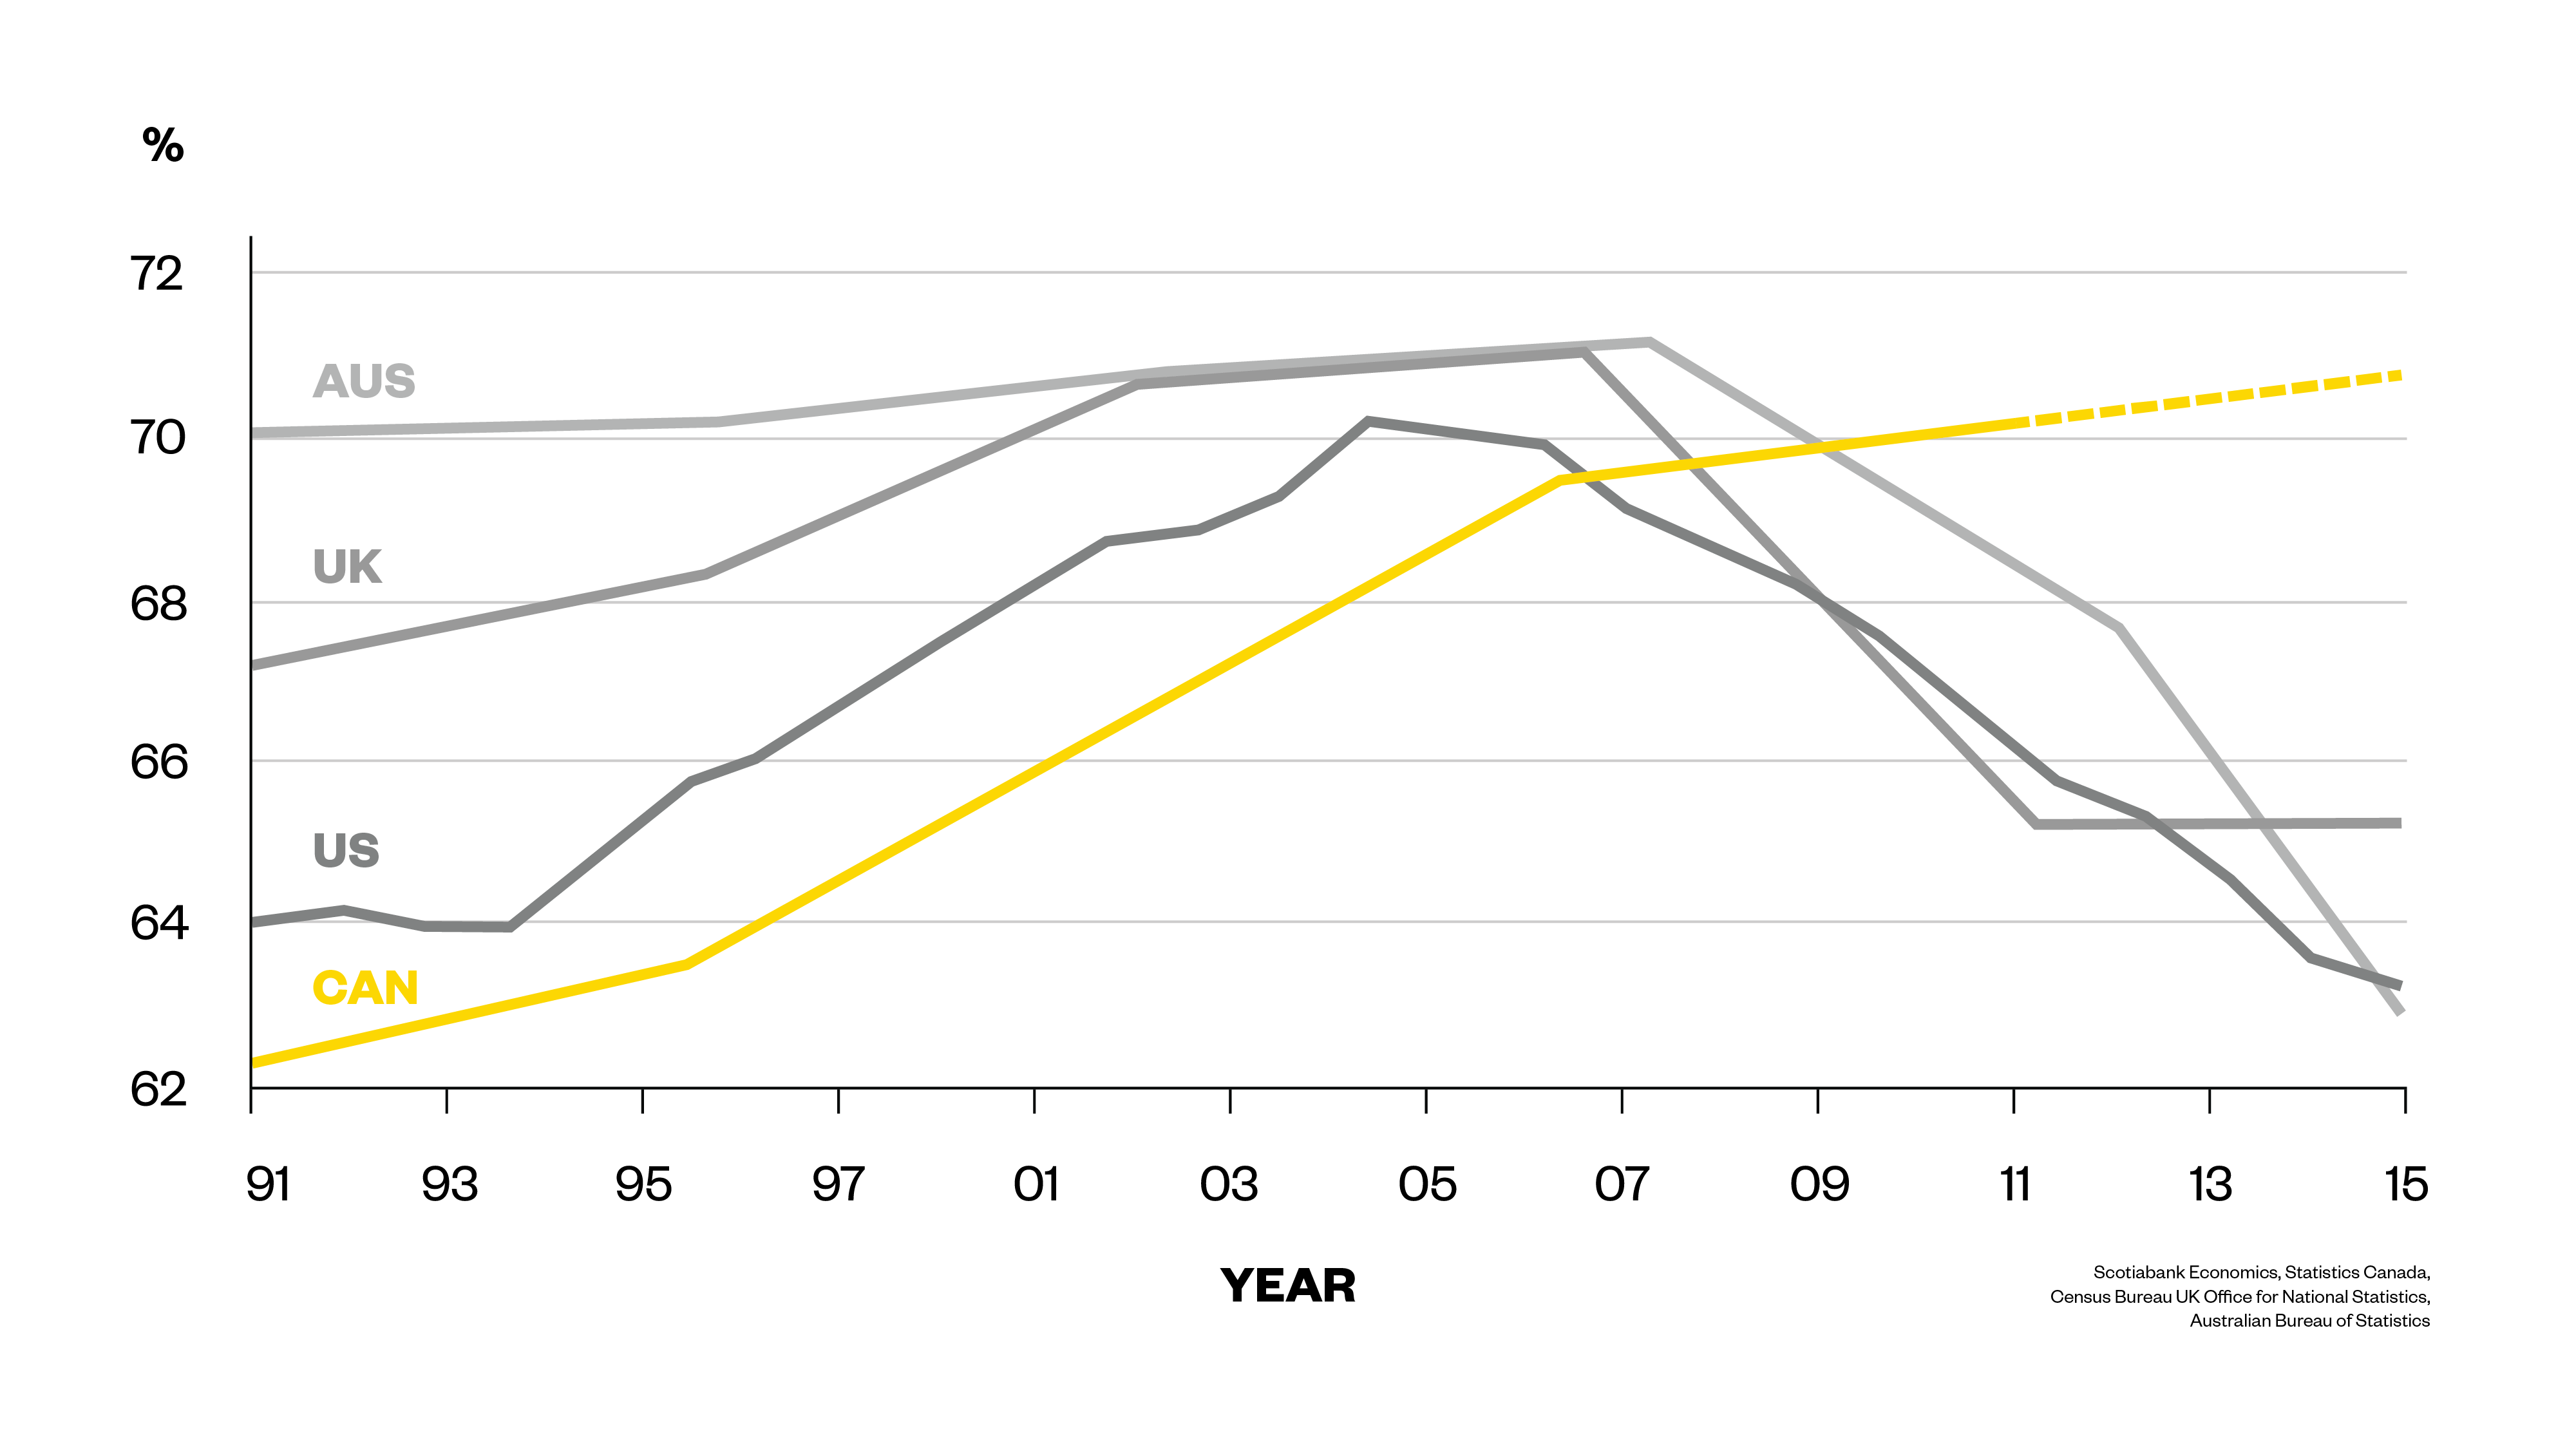
You would think enduring the worst economic crisis since the Great Depression would be a financially sobering experience for Canadians. Turns out, we’re even more infatuated by the whole four-bedroom home, two-car garage suburban lifestyle. Home ownership rates in Canada have shot up significantly since 2008, compared to Australia, the U.S. and the UK. This actually directly correlates to the sharp lowering of interest rates — cheap borrowing rates have encouraged Canadians who wouldn’t typically be able to afford mortgage payments to enter the real estate market.
Chart 2: There are more Canadians working in the housing sector than ever before
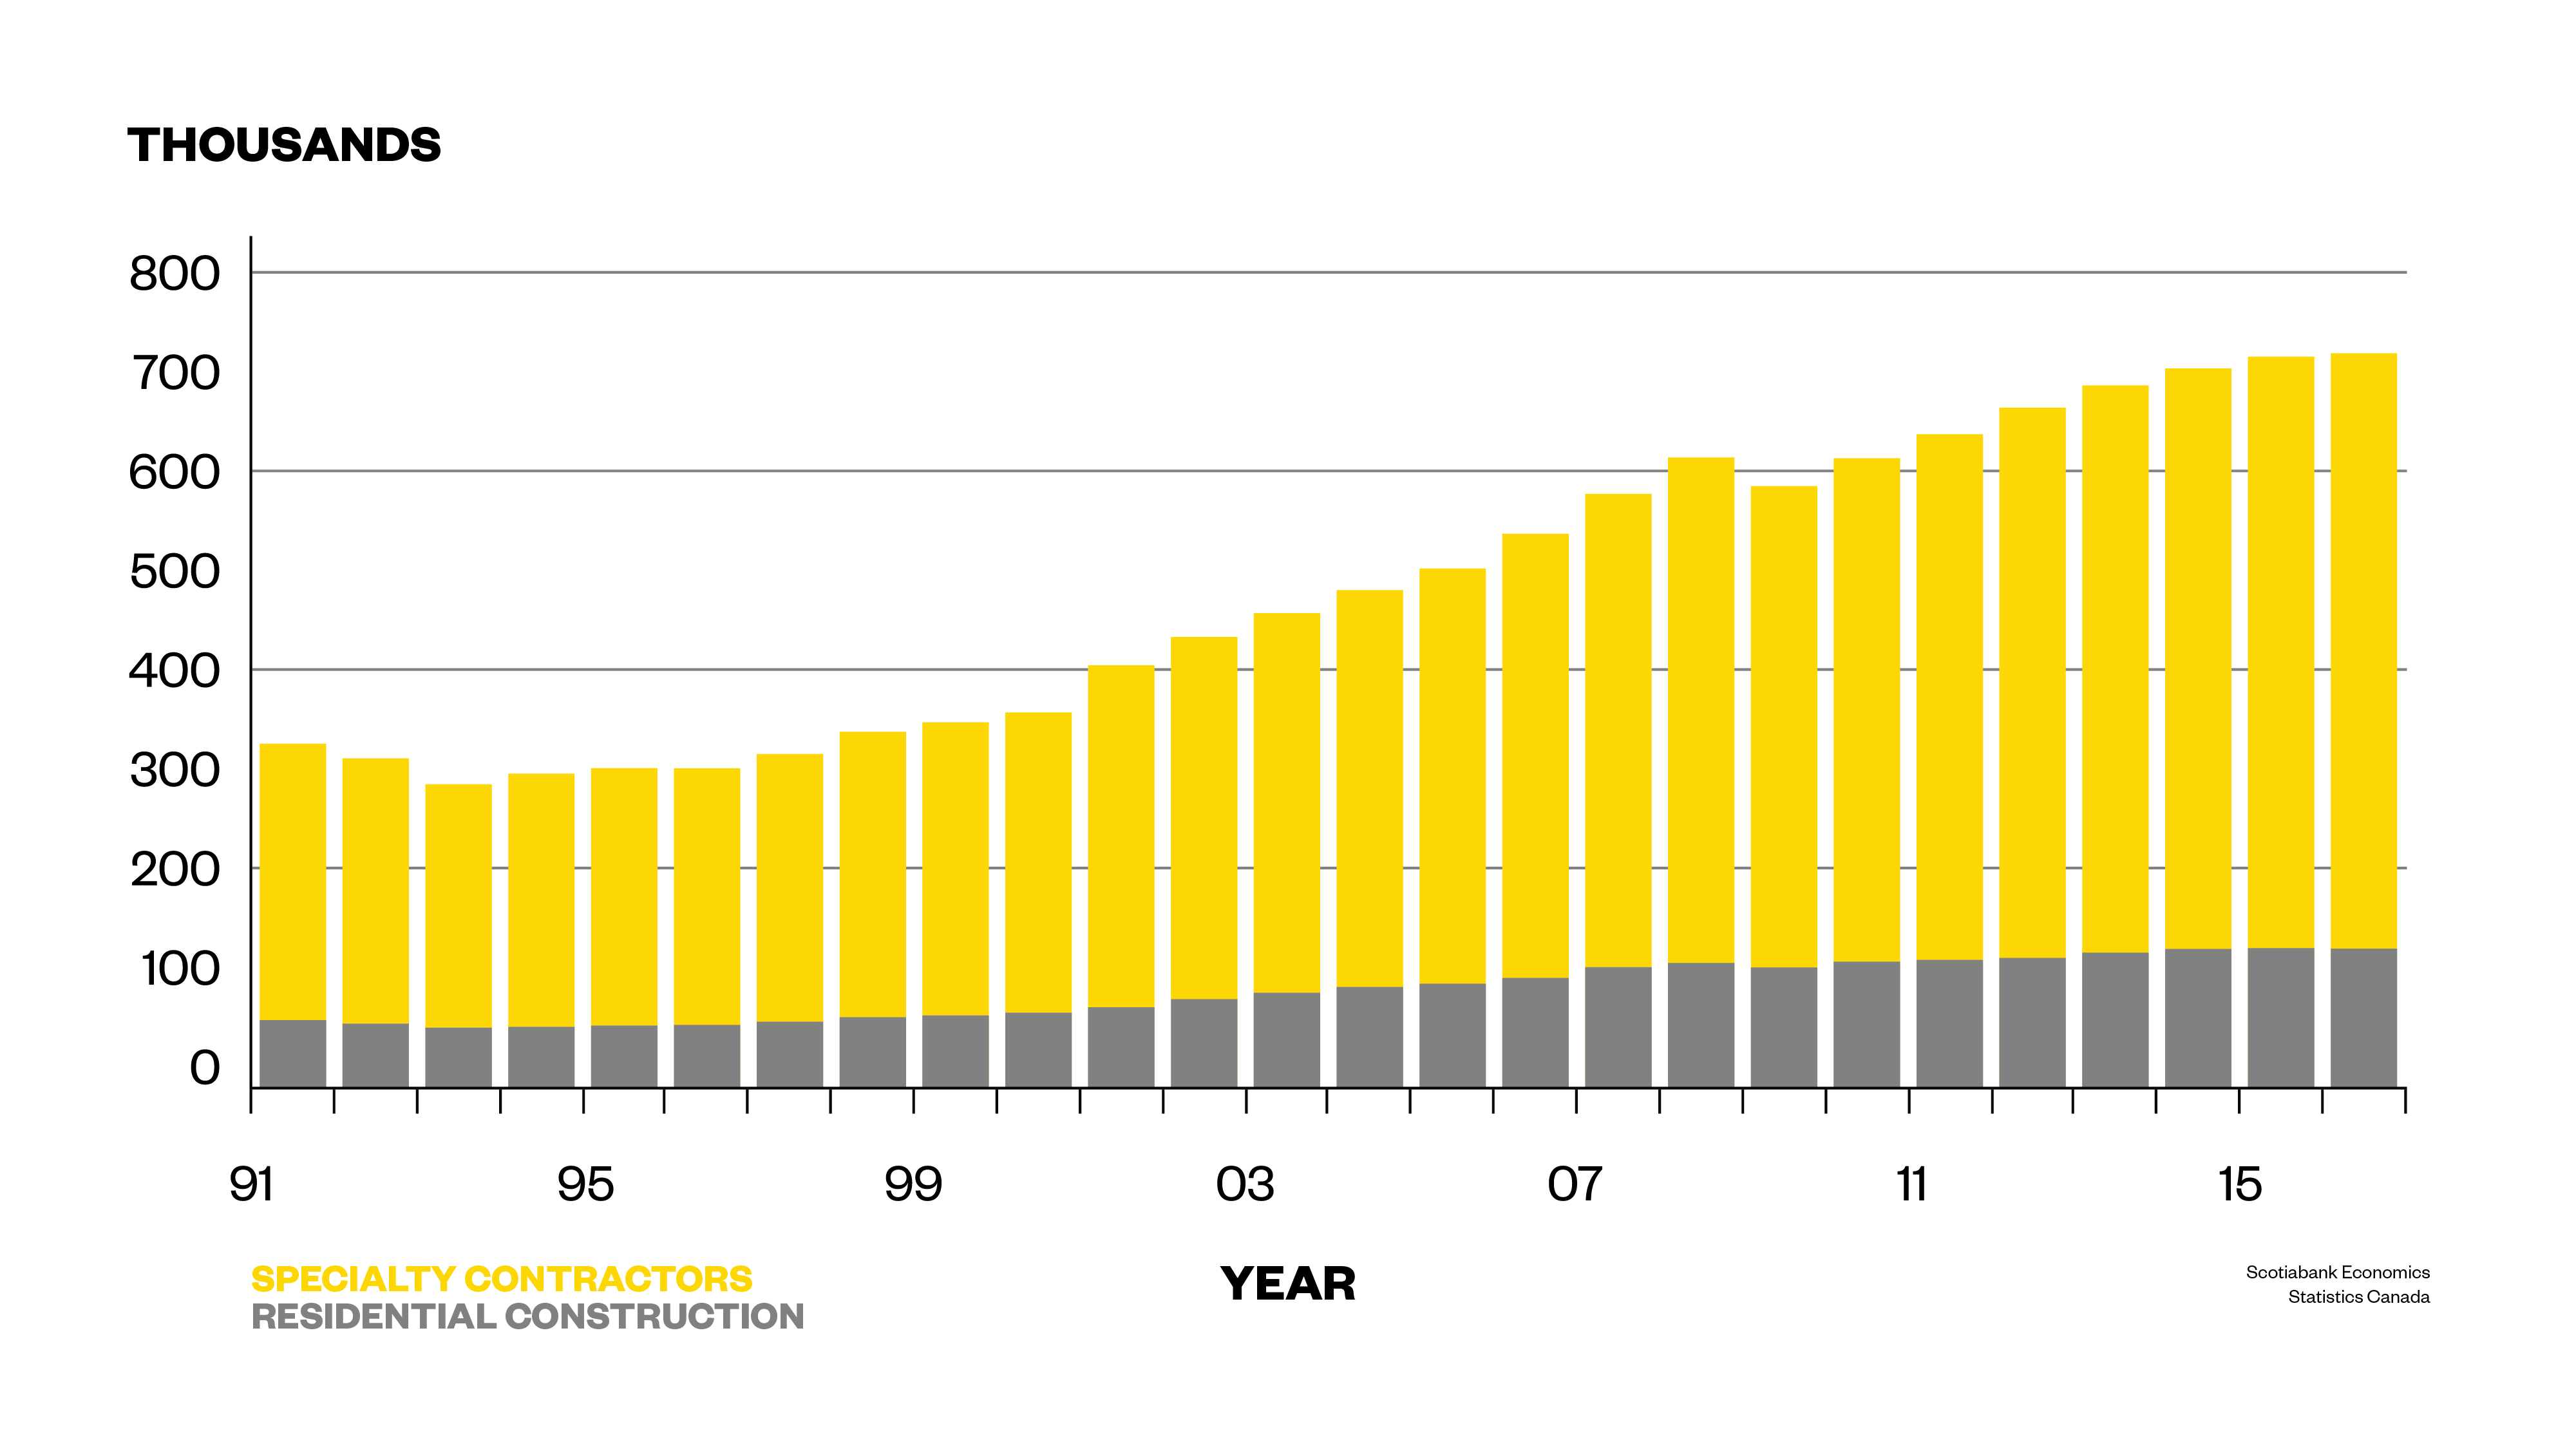
Cities like Toronto, Vancouver and Calgary have densified at a significant rate. Population growth, the result of immigration and interprovincial migration means that more homes have had to be built to accommodate the growing number of urban-dwellers. The subsequent increase in home prices (due to rising demand from low interest rates and population growth) has made it extremely lucrative for property developers and construction companies to build more homes. This has contributed immensely to job creation in the construction sector, which is clearly indicated on this chart. What’s problematic, however, is the potential of serious job losses in the construction sector in the event of a housing bust.
Chart 3: Home prices in Canada versus the U.S. since 2000
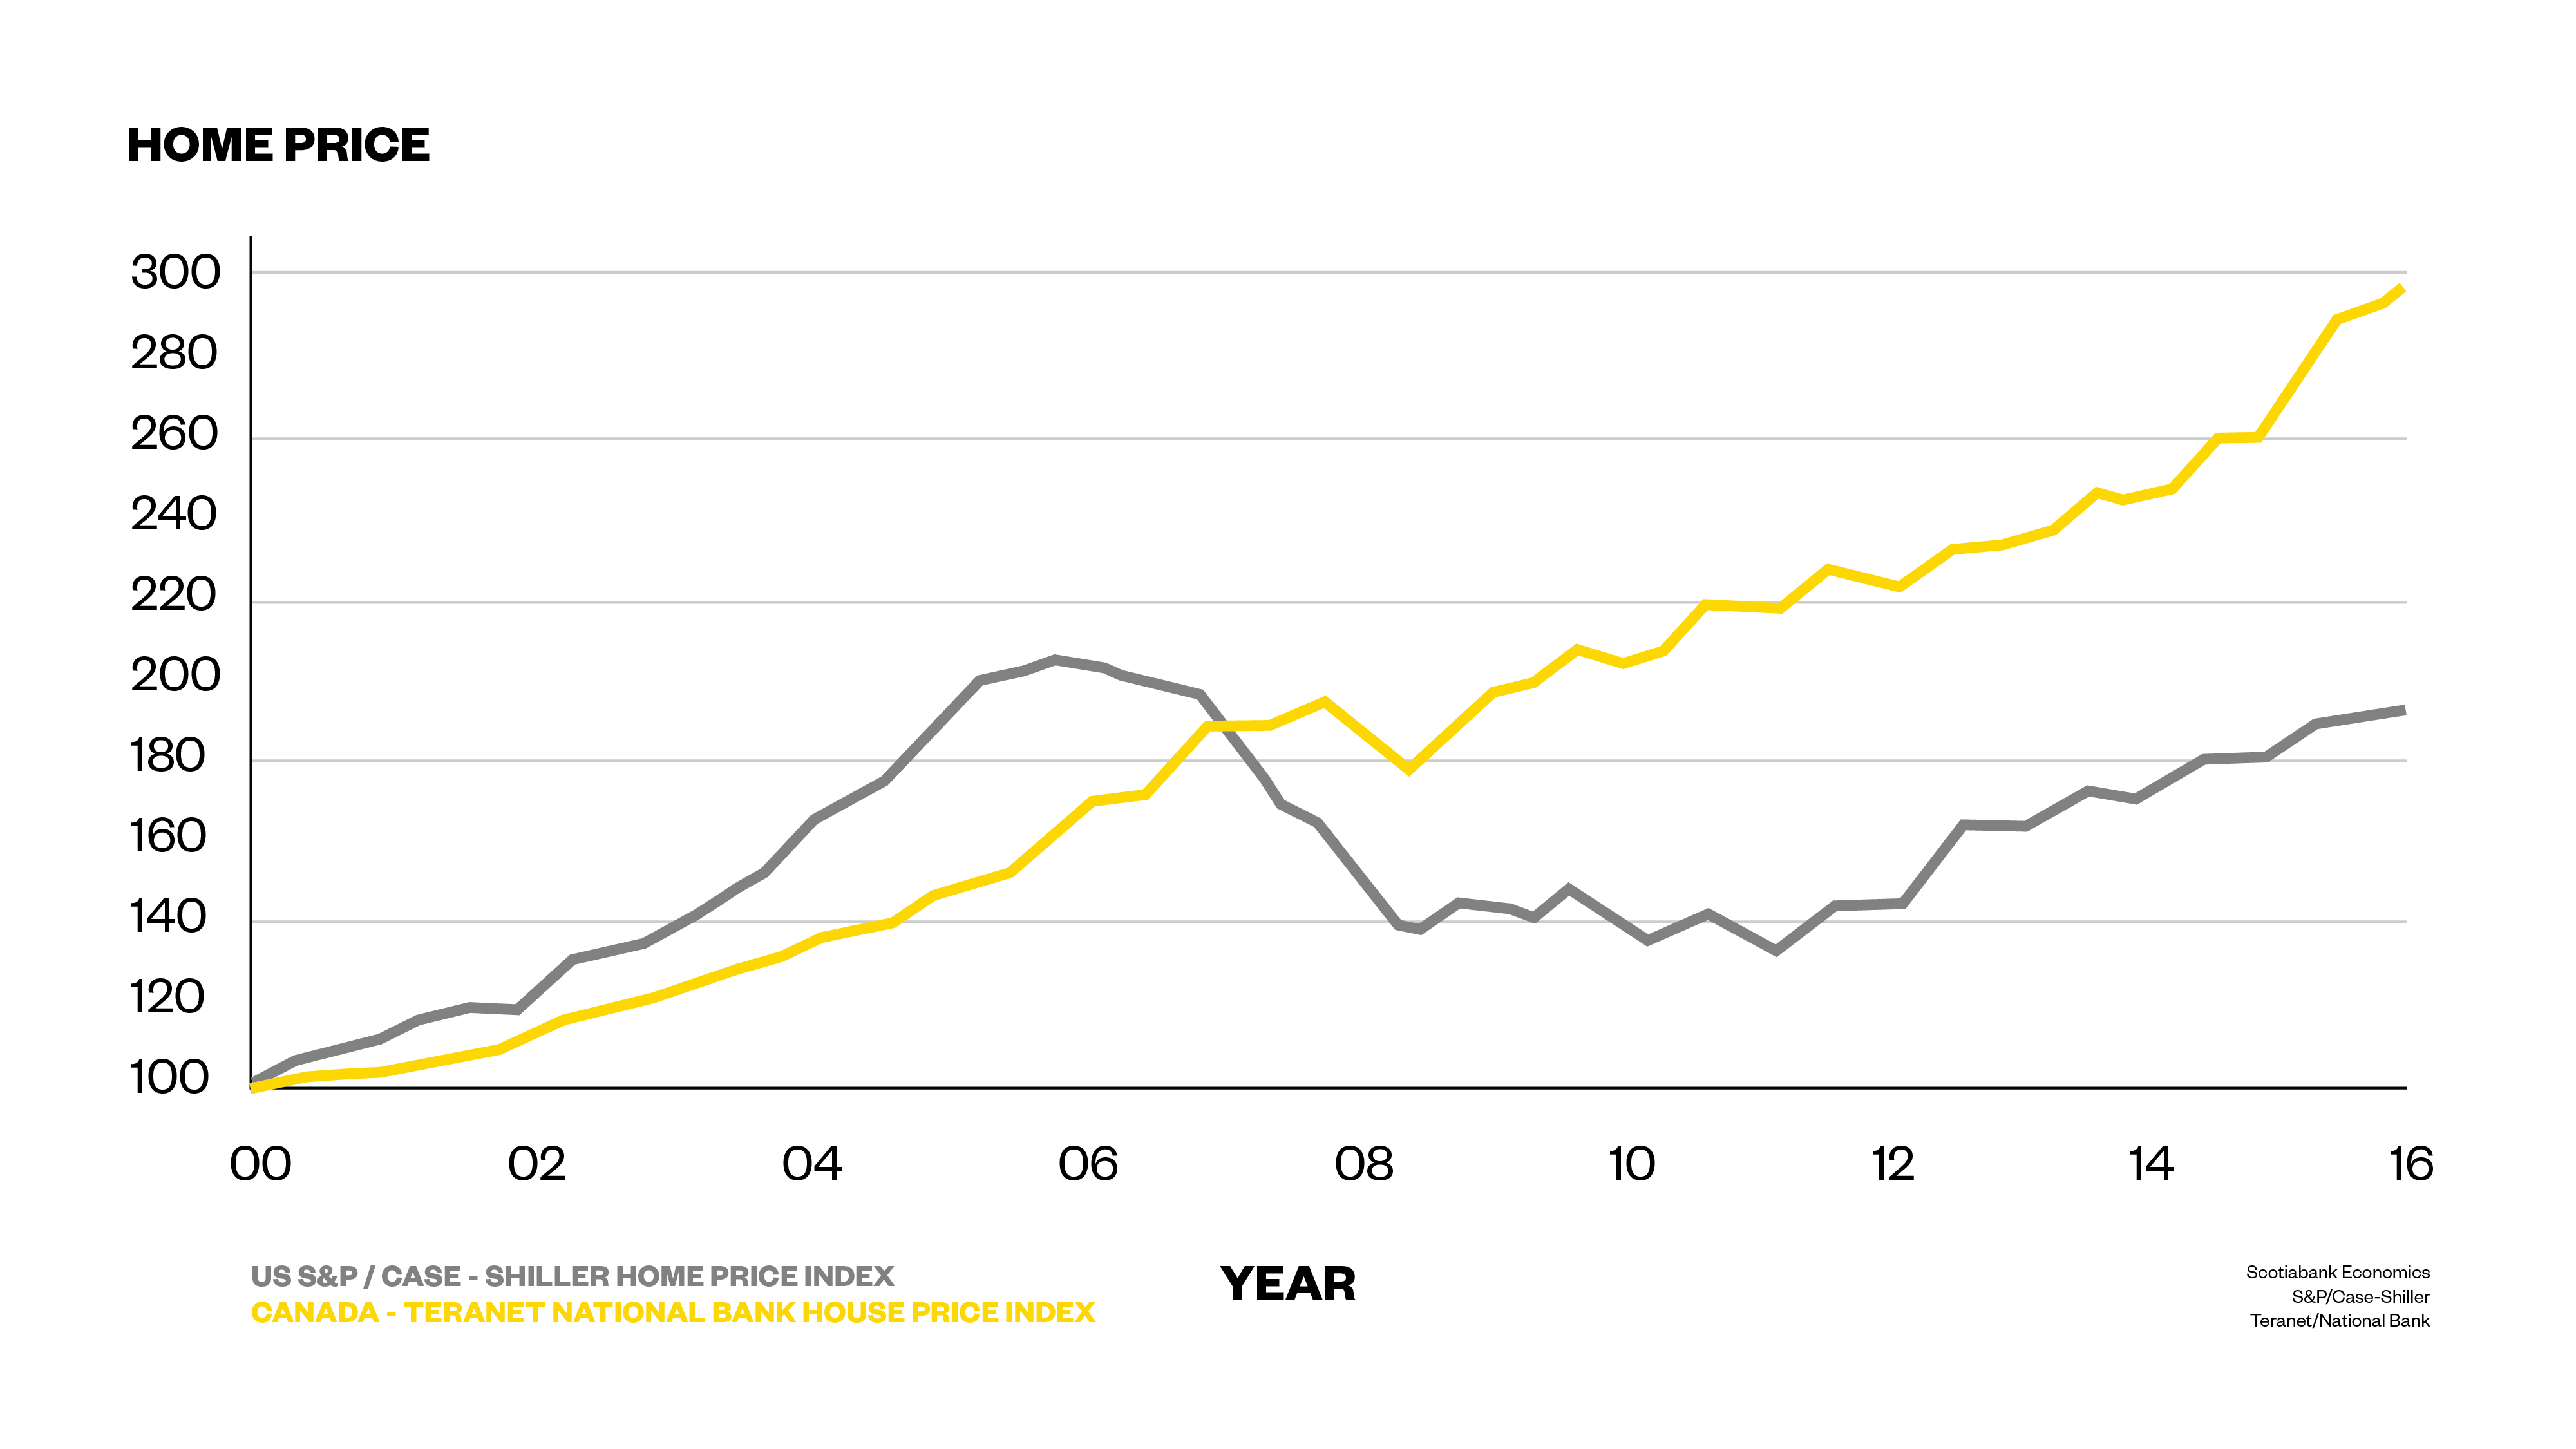
This is by far, the clearest indication that the Canadian housing market is on a dangerous path. By no means have incomes in Canada risen so much more than incomes in the United States to justify the way in which home prices have shot up in Canada. In fact, because this chart shows the national average home price, it doesn’t begin to reflect the way in which home prices have gone up in Toronto (33 percent in one year) and Vancouver (25 percent in one year). Take note that again, home prices in both countries have risen post-2008, again a direct correlation to the unprecedented low interest rate environment most of the developed world has lived in since 2009.
Chart 4: Home prices are going up, but our incomes aren’t
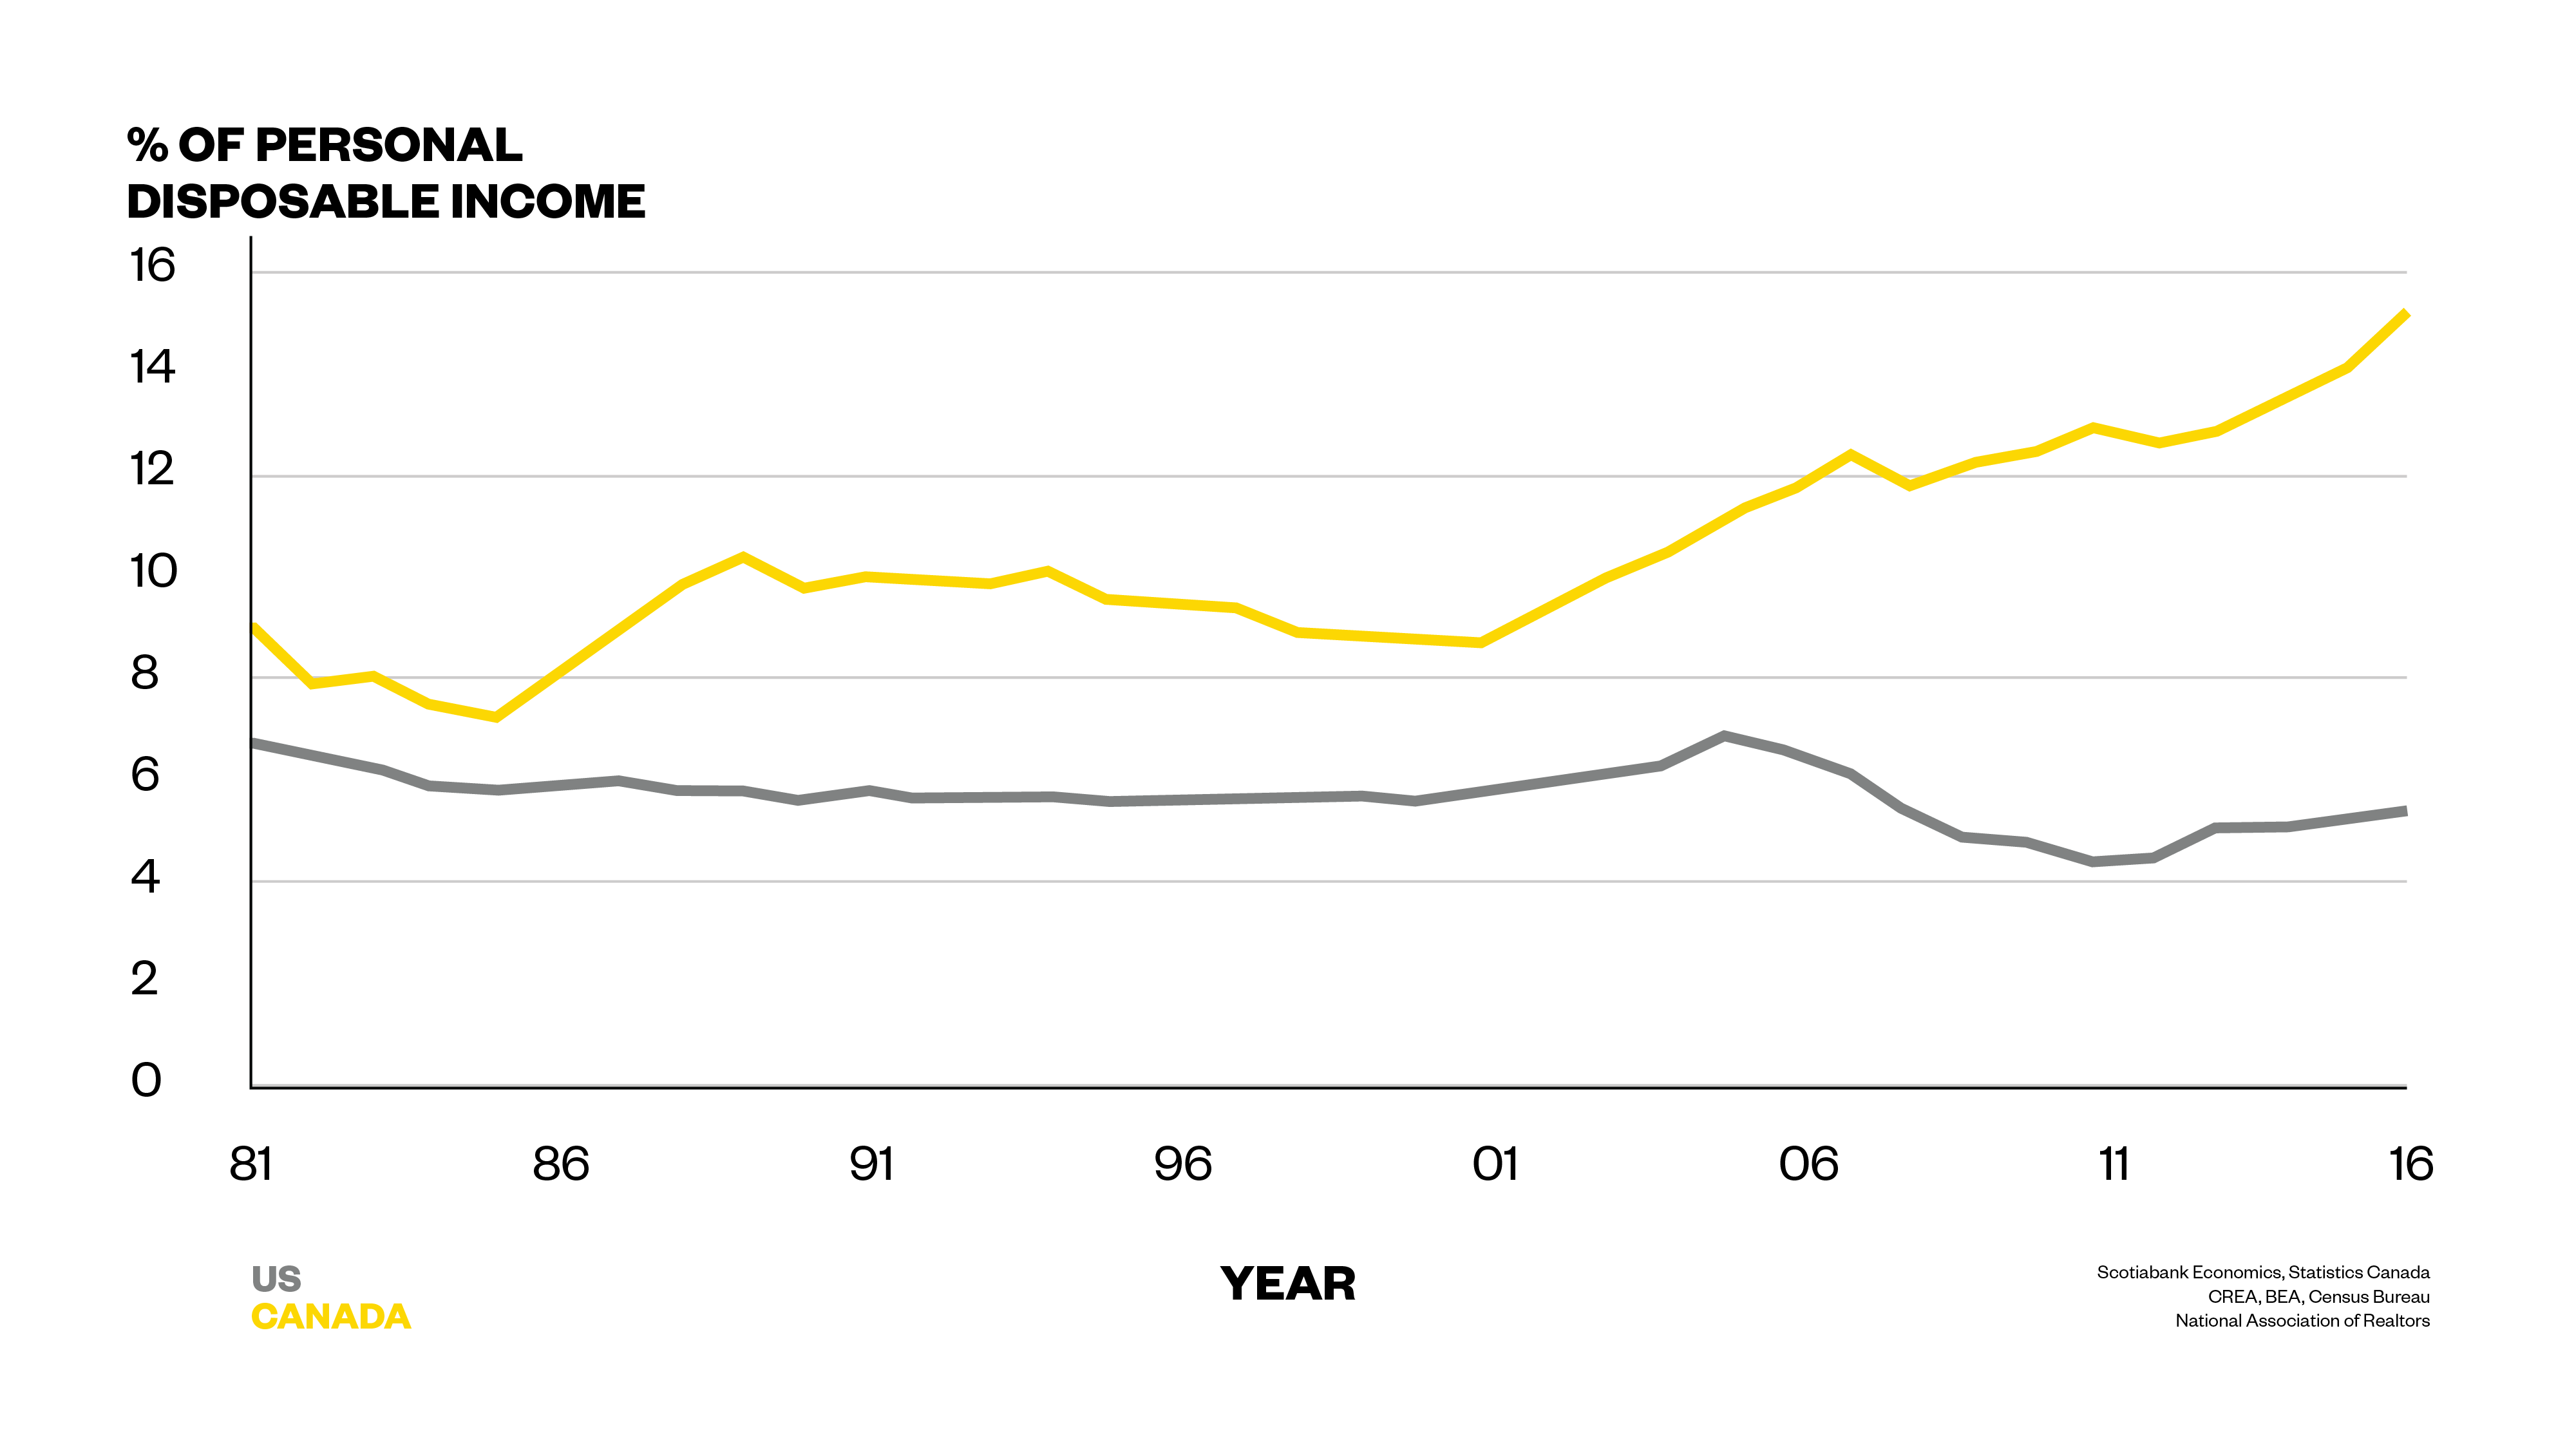
A variation of Chart 3, this breaks down the ratio of home prices to average personal disposable income. If the ratio goes up (which is happening in both Canada and the U.S., as indicated in the chart), that means there’s a bigger disparity between how expensive a home is, and what you can afford. It’s pretty clear, according to this chart that your personal disposable income is an increasingly unimportant factor when deciding whether to jump into the housing market. Home prices have gone up so much more in Canada than the U.S., yet personal disposable incomes in both countries remain relatively similar.
Chart 5: Turns out, two-thirds of Canadian households don’t even have a mortgage
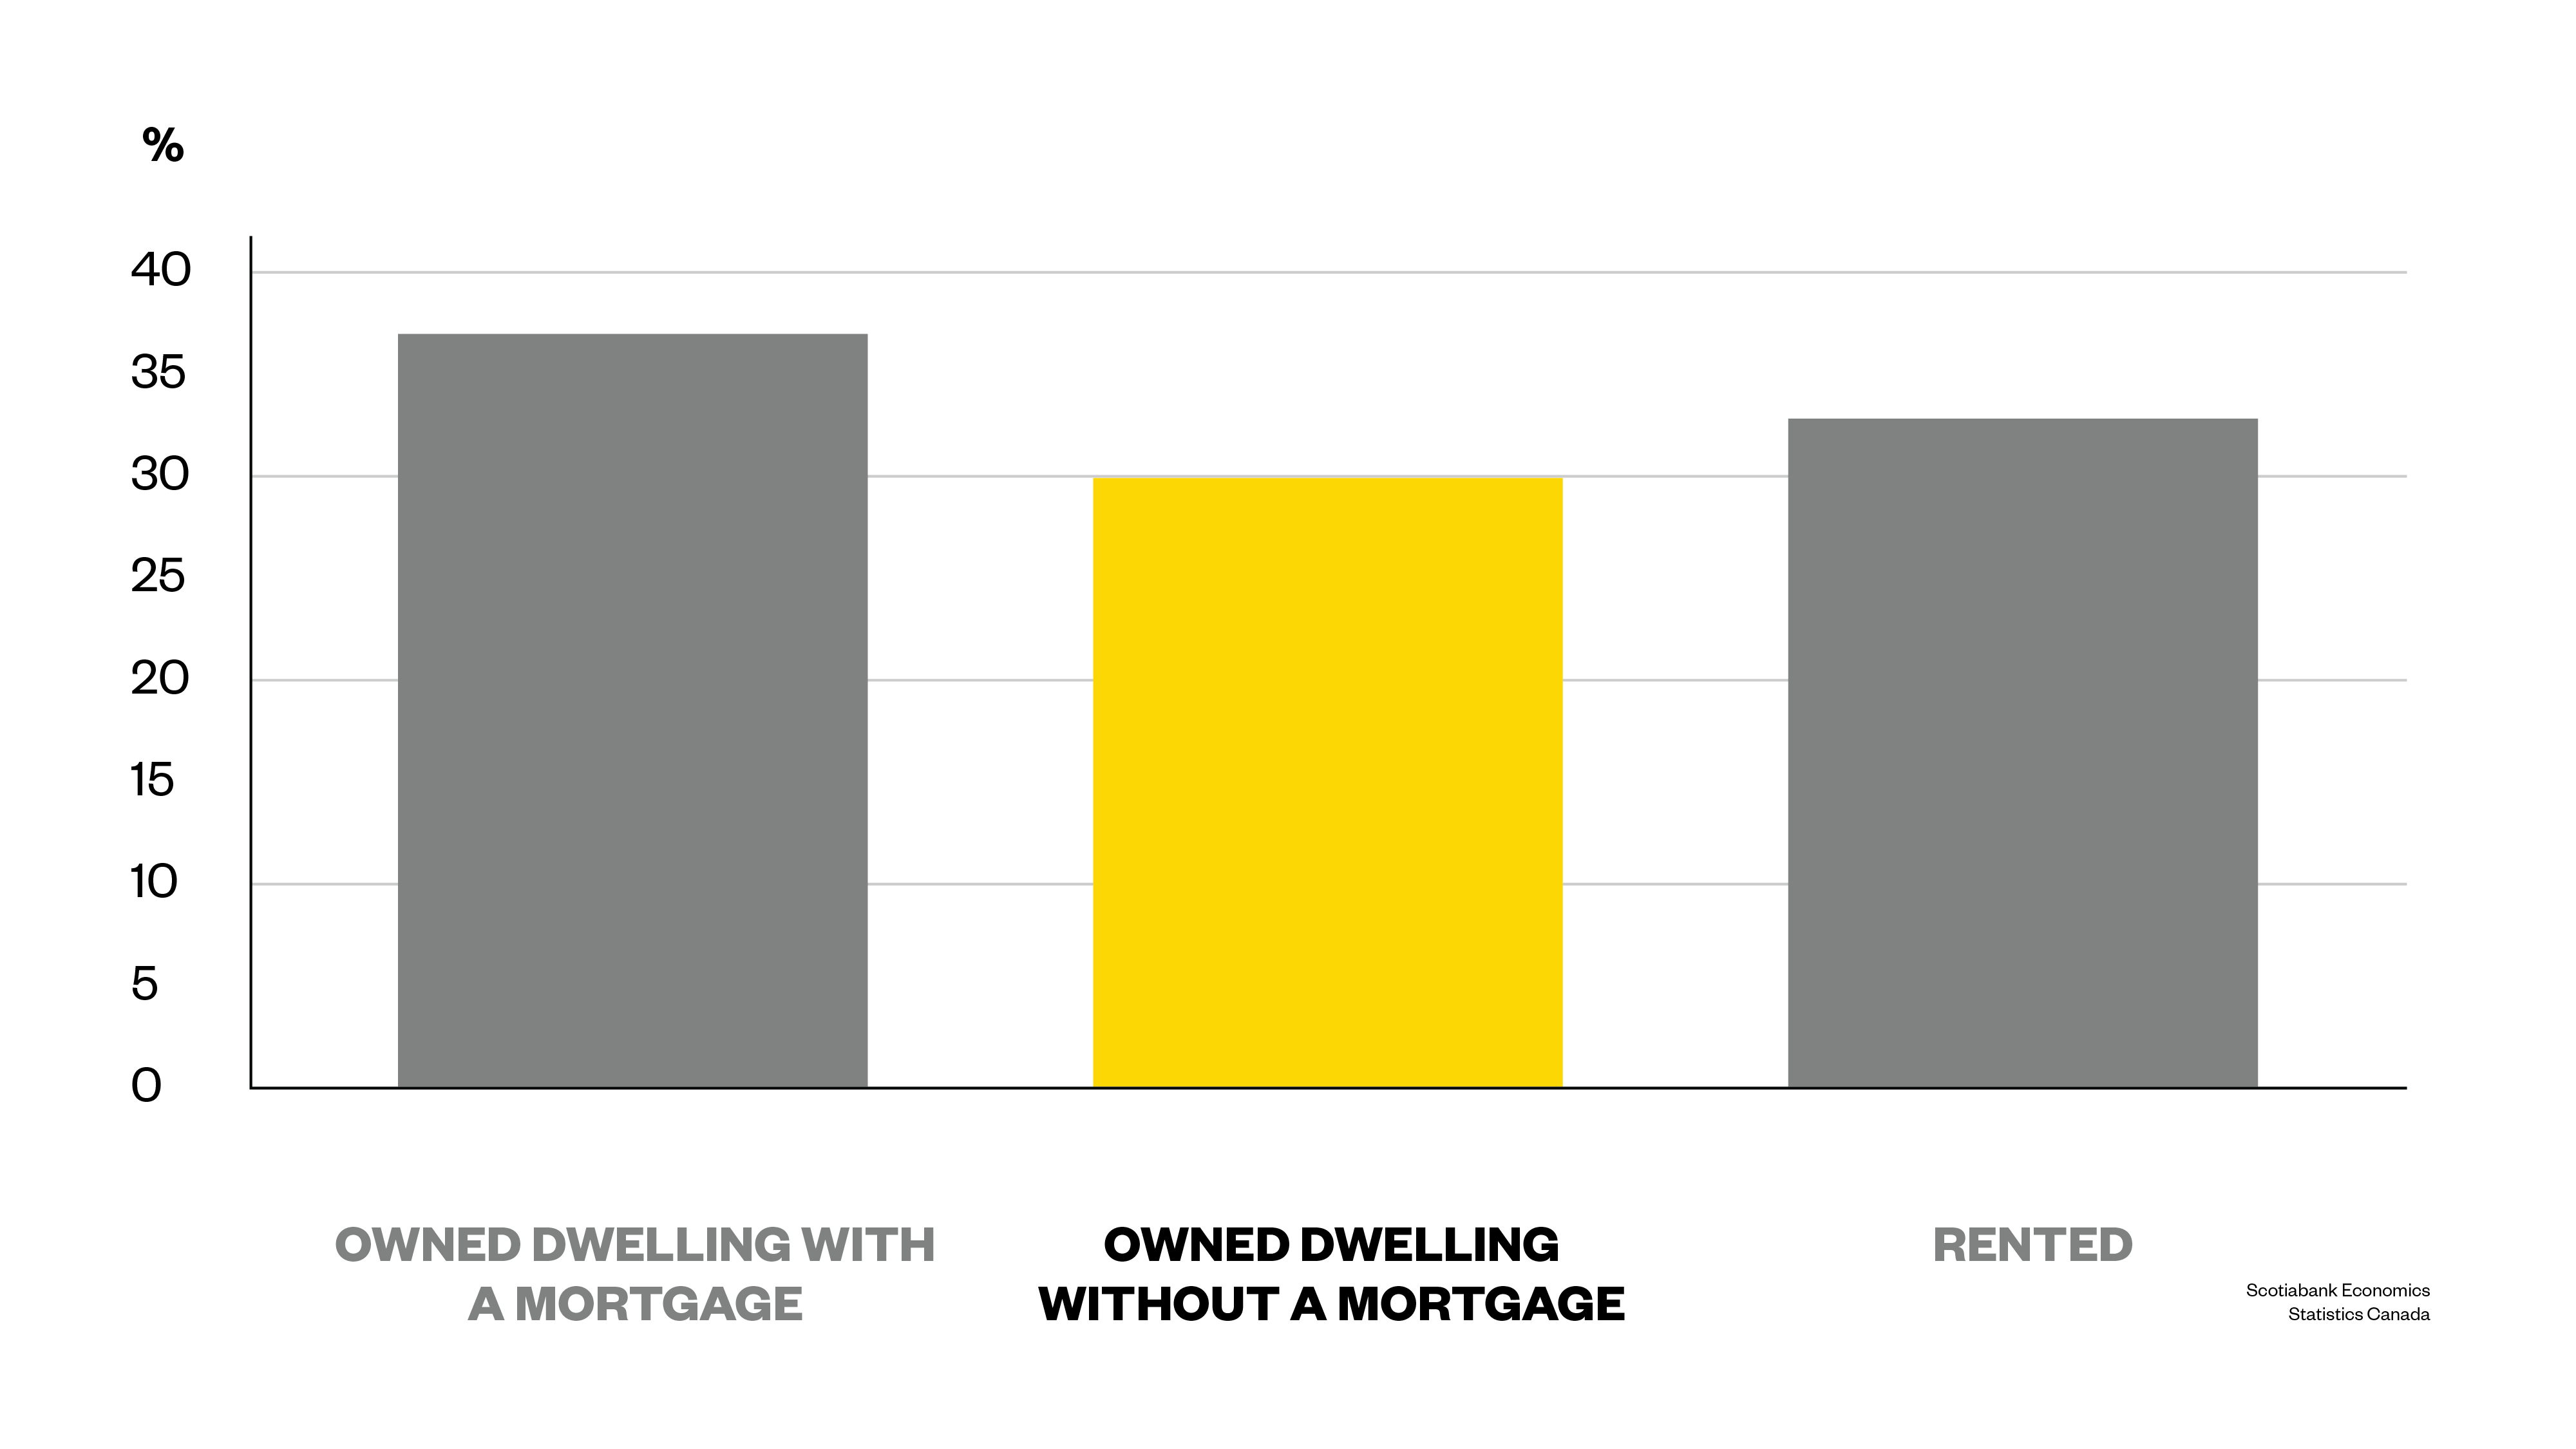
I was pretty surprised when I stumbled upon this chart, courtesy Scotiabank Economics. Although home ownership rates have gone up, and home prices have gone up in tandem with that, about 30 percent of Canadians who own a home, don’t have a mortgage. This is actually extremely positive, because it means that when interest rates finally go up, one-third of Canadians will be unaffected (assuming they don’t have other forms of debt from credit cards, payday loans and lines of credit).
What’s also interesting in this chart is the number of Canadians who rent — 33 percent. Rental rates are much higher in cities like Toronto and Vancouver, simply because home ownership is much more unaffordable. In fact, the number of Canadians in the rental market is just slightly lower than the number of Canadians who own homes with mortgages, an important fact to keep in mind when discussing Canada’s overall housing affordability problem.


