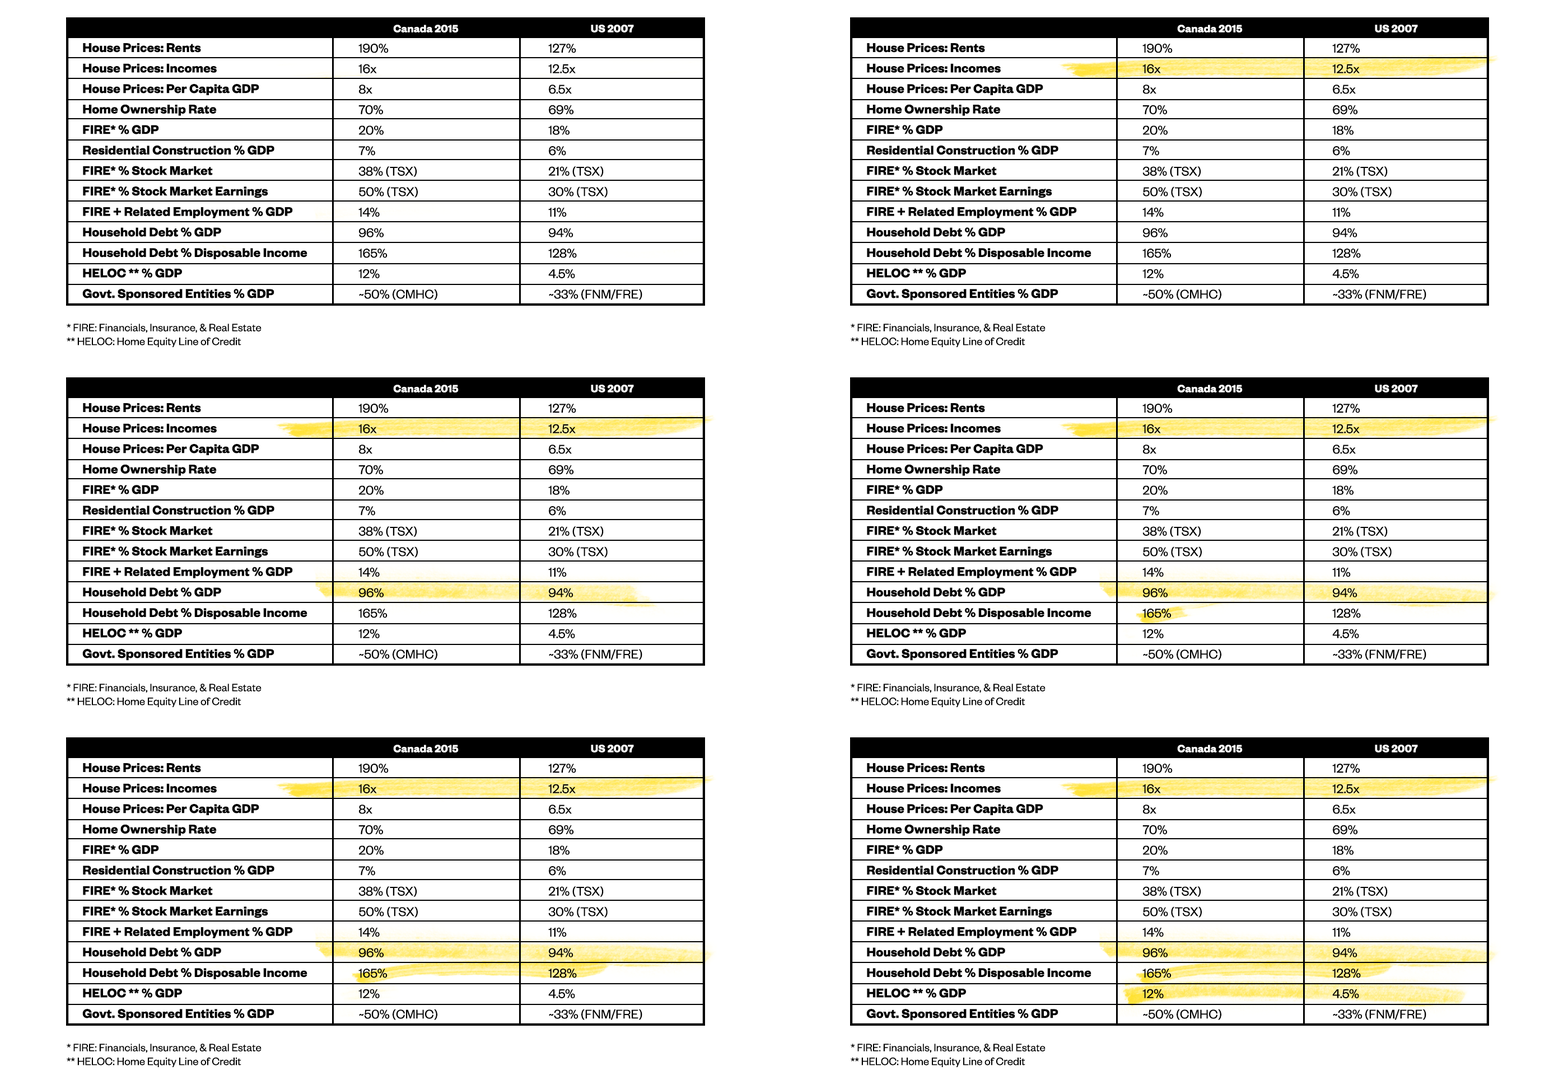
There’s an interesting chart that has been floating around the Twitterverse recently — it tells the tale of Canada’s housing market through the lens of the U.S. housing sector in 2007, a few months before the subprime mortgage crisis hit, and everything came tumbling down.

According to these numbers sourced by Seth Daniels, known Canadian housing bear and Managing Partner at investment research firm JKD Capital, average house prices in Canada in 2015 were 16 times annual household income. So even at the height of the exuberance towards the U.S. housing market in 2007, American homes were slightly more affordable relative to income than Canadian homes. And remember, that was the point in which the prevailing philosophy on housing was much similar to what we hear from real estate players here in Canada — no, the market hasn’t reached it’s peak yet. Home prices can only go up.
Videos by VICE
The two statistics that are particularly interesting from this table are the percentage of household debt to disposable income, and the percentage of home equity lines of credit relative to Gross Domestic Product (GDP).
Let’s take that first stat. If Canadian household debt to disposable income is 165 percent, that basically means that we owe $1.65 on every dollar we earn. These are actually 2015 figures. The latest numbers on household debt show that for every dollar of disposable income earned, we owe $1.68, mostly on mortgages.
Americans, on average, in 2007, owed $1.28 for every dollar of disposable income, a number that was considered ludicrous by economists and experts at the time. One of them, Sheila Bair, sounded the alarm bells on how over-leveraged on housing she thought Americans were, back when she was the head of the U.S. Federal Deposit Insurance Corporation (a U.S. government entity created to guarantee the safety of bank deposits). According to Bair, the seeds of the financial crisis were not sown by borrowers, but by mortgage originators who convinced the average American that they could afford to borrow way more than they could actually pay back.
“Two-thirds of houses were owned by legitimate homeowners who had taken cash-out refinancing because they were desperately trying to hold on to their homes,” Bair writes in her 2013 book on the subprime mortgage crisis, Bull By The Horns.
Which brings us to the second staggering statistic — the percentage of home equity lines of credit (HELOC) to GDP. Now HELOCs aren’t conventional mortgages. They are set up as a line of credit with a maximum draw, meaning the lender can advance you up to the maximum of your HELOC, at any time of your choosing. Because of the flexibility of its lending terms, HELOCs are often seen as second mortgages, or rather, money used to refinance your first mortgage.
HELOCs were incredibly popular in the U.S. in the lead up to the subprime mortgage crisis, mostly because of the promise from banks that they could be used to refinance your existing mortgage, so you’d never really have to worry about not having the money to pay your monthly mortgage bills. What’s shocking, looking at this table, is that the composition of Canadian HELOCs to GDP is three times that of the U.S. in the lead up to their housing crash.
Of course however fascinating these numbers are, it is worth noting that this it is just one source of statistics, by a popular Canadian housing pessimist, who advises a short-focused fund in Toronto (i.e. a fund that makes money off any kind of sector crashes, like housing).
And, as CIBC economist Benjamin Tal notes, Canada’s mortgage default rate so far, is only 0.2 percent, a far cry from U.S. defaults, which at their worst, were roughly 7 percent of all mortgages.
But what cannot be denied is that the Canadian real estate sector has been fueled by a debt-binge and easy bank lending — a dangerous combination that contributed heavily to the mortgage mess south of the border.
Vanmala is VICE Canada’s Money & Economics Editor. Follow her on Twitter.


